Your Meta ROAS dropped 30% this quarter. Your Google CPC keeps creeping up. Your creative team is being blamed. Your media buyer is being questioned. Your CFO wants answers.
The answer might not be in your ads. It might be in your app store.
Every Shopify app you install adds JavaScript to your storefront. Every popup, review widget, currency converter, cross-sell tool, and "smart" recommendation engine loads scripts that run on every page a customer sees. The average Shopify store has 15-20 apps installed. The average PageSpeed Insights mobile score for a Shopify store is 25-35 out of 100. And those two facts are directly related.
Here's the mechanism nobody's connecting: your app stack is making your storefront slow. Your slow storefront is dropping mobile conversion rates. Dropping conversion rates are silently raising your customer acquisition cost on every paid channel. You're not paying more per click. You're just converting a smaller percentage of the clicks you're paying for.
This post is the operator's audit for finding the specific apps that are killing your performance, calculating what they're actually costing you, and rebuilding your stack around what your business genuinely needs.
The Core Web Vitals reality most operators haven't clocked
Google measures your store's performance across three specific metrics, and if you're on Shopify, chances are you're failing at least two of them right now.
LCP (Largest Contentful Paint) — how quickly your main content becomes visible. Google's "Good" threshold is under 2.5 seconds. Most Shopify stores hit 4-6 seconds on mobile because of render-blocking scripts and unoptimised hero images.
INP (Interaction to Next Paint) — how fast your page responds when someone taps something. Threshold: under 200 milliseconds. Heavy third-party JavaScript is the primary killer here. INP replaced FID as a Core Web Vital in March 2024, and it's now measured across every interaction in a session, not just the first click. Meaning a customer who taps "Add to Cart" and waits 800ms for a response is telling Google your store fails INP, even if the initial page load was fast.
CLS (Cumulative Layout Shift) — how much things visually jump around while loading. Threshold: under 0.1. App widgets that inject content after page load — sticky bars, review widgets, cookie consent popups — are the top offender.
Google uses field data from real Chrome users at the 75th percentile. Which means it doesn't matter how fast your store is on your laptop with fibre broadband. It matters how fast it is on a 4G connection on a mid-range Android phone in Wolverhampton on a Tuesday afternoon.
The average Shopify store fails all three metrics. Yours probably does too, and the primary reason is your app stack.
The specific math on how bloat raises your CAC
Let's make this concrete with numbers you can plug into your own P&L.
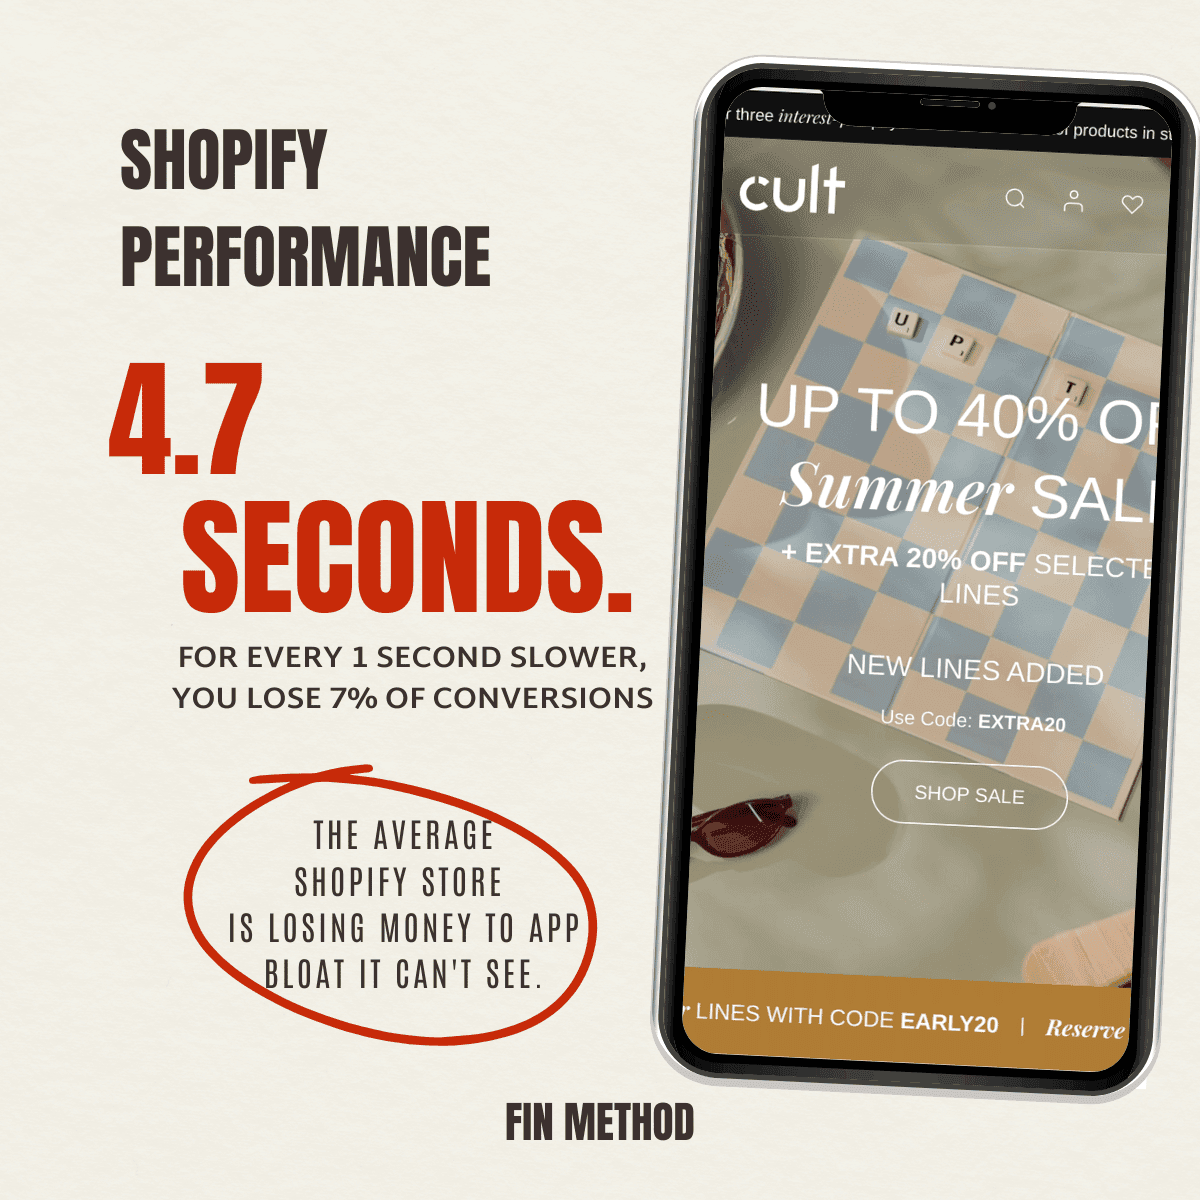
Multiple studies across ecommerce (Amazon's original research, Portent, more recent 2026 audits) consistently show that a 1-second delay in mobile page load reduces conversion rates by around 7%. Some categories see up to 20% conversion loss on 3-second delays. Rakuten increased conversion rate by 33% after Core Web Vitals optimisation. Vodafone saw 8% more sales after improving LCP by 31%. These are real, published, named brands with verifiable numbers.
Here's how that translates to CAC:
Your Meta campaign spends £1,000 and drives 1,000 clicks to your product page. At a 3% conversion rate, you get 30 orders. Your effective CAC is £33.
Same campaign, same £1,000, same 1,000 clicks — but your page loads 1 second slower. Conversion rate drops from 3% to 2.79% (a 7% relative drop). You now get 27.9 orders. Your effective CAC is £35.85.
That's £2.85 more per customer, per 1-second delay, on the same ad spend. Doesn't sound catastrophic in isolation. Now multiply it across a year of media spend, across a store loading 3 seconds slower than the Core Web Vitals threshold, on a channel where CAC efficiency is genuinely competitive.
A mid-size UK Shopify store spending £15,000/month on Meta with a 2-3 second slower load than optimal is bleeding roughly £8,000-£15,000/year in acquisition efficiency. That's before you factor in the Google search ranking impact (Core Web Vitals failures reduce organic visibility, dropping top-of-funnel traffic entirely).
The frustrating part: this looks like an advertising problem in your reporting. It's not. It's a Shopify problem in your storefront.
The three types of app bloat killing your performance
Not all apps are equal. Some are lightweight and load asynchronously. Some are catastrophically bloated and block the render entirely. Knowing which is which is 80% of the audit.
Type 1 — Render-blocking scripts (worst offender for LCP)
These scripts load synchronously at the top of the page and prevent anything else from rendering until they finish. Common culprits: older review platforms, custom fonts loaded blocking, older popup apps.
Symptom in field data: LCP over 3 seconds on mobile even with reasonable image sizes.
Type 2 — Main-thread JavaScript blockers (worst offender for INP)
These run heavy computation on the main browser thread, making the entire page unresponsive to taps and clicks. Common culprits: recommendation engines running client-side, real-time inventory checkers, complex cross-sell logic.
Symptom in field data: INP over 400ms. Add-to-Cart tap feels laggy. Variant pickers hesitate.
Type 3 — Post-load layout shifters (worst offender for CLS)
These inject content into the page after the initial render, causing elements below them to jump down. Common culprits: currency converters, cookie consent banners without reserved space, sticky "recently viewed" widgets, urgency banners.
Symptom in field data: CLS above 0.15. Users misclick things because buttons moved just as they tapped.
Most Shopify stores have all three types running simultaneously. Which is why the average PageSpeed Insights mobile score is 25-35 out of 100.
The 5-step Shopify app audit workflow
This is the workflow. Do it once per quarter minimum. First time takes 90-120 minutes for a mid-size store. Subsequent audits take 30-45 minutes.
Step 1 — Get your real Core Web Vitals baseline
Open Google Search Console → Core Web Vitals report. This shows you field data from real Chrome users on your store — not synthetic test data.
Note your current numbers for LCP, INP, and CLS on both mobile and desktop. Mobile is the number that matters most (70%+ of Shopify traffic is mobile).
Also open PageSpeed Insights → run your homepage, top collection page, and top product page URL. Note the mobile scores. If they're under 50, you have a serious problem. If they're under 30, you're leaving significant revenue on the table.
Step 2 — List every app installed on your store
Shopify Admin → Apps and sales channels. List every app currently active. Include the app name, what it does, and — critically — whether you've actively used or configured it in the last 30 days.
You'll almost certainly find:
- Apps installed 2 years ago that you don't remember
- Apps installed to test something and never uninstalled
- Apps installed by former team members for use cases that no longer exist
- Apps that duplicate functionality (two review platforms, three upsell tools)
The average Shopify store has 15-20 apps installed. Legitimate businesses need 5-8 apps for their actual operations. Most stores are running 40-60% dead weight.
Step 3 — Classify each app by performance impact
For each active app, categorise:
Essential (keep): Directly serves customers or handles critical operations. Examples: your review platform (if you actually use it), your email capture tool, your subscription manager if you sell subscriptions.
Nice to have (audit): Adds functionality but doesn't drive revenue directly. Examples: cross-sell widgets, popup upsells, "customers also viewed" tools. Test whether disabling each one measurably affects conversion. Most don't.
Bloat (uninstall): Installed and forgotten. Duplicates functionality of another app. Runs but produces no measurable value. Examples: three different review platforms, currency converter you don't need if you're using Shopify Markets, urgency banner you set up during a sale two years ago.
For every app in the "audit" and "bloat" categories, note the specific JavaScript weight it adds to your storefront. Most app developers publish this or you can find it via Chrome DevTools Network tab.
Step 4 — Test the impact of removing bloat
Before uninstalling anything, run your current PageSpeed Insights baseline.
Then uninstall or disable one app at a time. After each removal, run PageSpeed Insights again. Note the score change and specifically what improved (LCP, INP, or CLS).
You'll typically find:
- 3-5 apps that removed produce meaningful LCP improvements (0.3-1.0 second)
- 2-4 apps that improved INP by 50-150ms when removed
- 1-3 apps that produced significant CLS reductions
That's already a multi-second cumulative improvement in load time, from removing apps you weren't actively using.
Step 5 — Rebuild the stack strategically
After the audit, you should be at a smaller, more intentional app footprint. Now the strategic layer:
For any remaining apps, verify they load asynchronously. Most modern apps offer async loading options in their settings. Enable them.
For apps whose functionality overlaps with Shopify native features, migrate to native. Shopify has quietly built native versions of many things that used to require apps: product recommendations, discount codes, gift cards, basic upsells. Native is faster because it runs from the same codebase as your theme.
For high-value custom functionality that you need, consider a theme customisation instead of another app. A one-time theme customisation is typically faster, more permanent, and doesn't add per-page JavaScript overhead. Costs more upfront. Compounds over time.
What separates fast Shopify stores from slow ones
Fast Shopify stores are not lucky. They're not on secret hosting infrastructure. They're not paying £10k/month for optimisation.
They just made specific choices:
- 5-8 apps, not 15-20. Every app justifies its performance cost with measurable revenue impact.
- Theme customisations for anything custom. Instead of another popup app, they built the popup into the theme. One-time cost. Zero ongoing performance overhead.
- Aggressive image optimisation. Every image is properly compressed, sized responsively, and lazy-loaded below the fold.
- Recurring performance audits. Quarterly at minimum. Not "when things feel slow."
- Field data over test data. They measure Core Web Vitals from real users, not synthetic Lighthouse tests.
Slow Shopify stores tend to do the opposite of all five. They accumulate apps. They add apps instead of customising. They never audit images. They audit performance when it's a crisis, not a routine. They celebrate their PageSpeed Insights "97 on desktop" while their mobile field data is failing every metric.
The fix for a slow store isn't a bigger media budget to compensate for the low conversion rate. It's fewer apps, cleaner code, and a storefront that respects the fact that most of your customers are shopping on their phone.
What this means for your 2026 planning
The mobile-first, JavaScript-heavy, app-store-enabled Shopify ecosystem has quietly reached its performance breaking point. Google's Core Web Vitals thresholds haven't moved — but the average Shopify store's performance against them has gotten worse, not better, as brands stack more apps to solve more problems.
Old model: solve every business problem with an app. Trust that Shopify handles the performance. Accept whatever conversion rate you get.
New model: solve business problems with the leanest possible solution. Measure performance quarterly. Treat app installs as adding technical debt, not just adding features.
The stores that will win Q4 2026 are the ones auditing their app stacks now, cutting the dead weight, and shipping into peak season with a storefront that loads in under 3 seconds on 4G. Those stores will convert paid traffic at meaningfully higher rates than their bloated competitors and see effective CAC drop across every channel — without changing a single ad, a single audience, or a single piece of creative.
The stores that don't will spend Q4 blaming Meta's algorithm, testing new creative desperately, and watching their CAC climb because their storefront is silently discouraging a percentage of every visitor from converting.
Audit the stack. Cut the bloat. Test the change.
Or keep paying Meta 30% more to acquire customers who bounce because your cart button takes 800ms to respond.
Free downloadable audit template — run the analysis on your own store
I've built a free audit template that turns this post into an operational tool your team can actually work through.
The Shopify App Stack Performance Audit (Excel) — a working spreadsheet with dropdowns for evaluating every installed app across 11 criteria. Auto-calculating dashboard surfaces total monthly cost, verdict breakdown (Keep / Review / Remove), estimated SaaS savings from removal, and performance-driven revenue lift based on LCP improvement targets. Ships with a Read Me First tab explaining every column.
Free. Downloadable spreadsheet — no email required.
Before you engage anyone, download the audit template and work through your app stack with your team. Most operators find £50-200/month of dead-weight SaaS spend in the first pass, before any performance improvements.
If your store needs the underlying Shopify architecture rebuilt — not just the app stack cleaned up — Fin Method's UX & Funnel Optimisation (£750) covers the top six prioritised UX changes across your funnel including checkout and app-stack performance impact. Shopify Content & UX (£550) rebuilds one product or collection page for clarity and post-purchase alignment. And if the performance issue is deeper — theme-level — Shopify Theme Customisation (£950) rebuilds a page or theme component with performance and conversion as first-order requirements. Fixed price. No retainers.