Most founders treat returns as an unavoidable cost of doing D2C business.
The industry average for fashion and lifestyle sits somewhere between 20% and 35%. Everyone knows returns hurt margins. Everyone accepts that returns are a customer service problem that customer service teams handle. Everyone budgets for a returns line item and moves on.
Everyone is wrong.
Returns aren't a customer service problem. Returns are a systems problem — dispersed across packaging, product content, information design, and customer education. Fix the underlying system, and returns collapse. Treat returns as a support-desk task, and they compound.
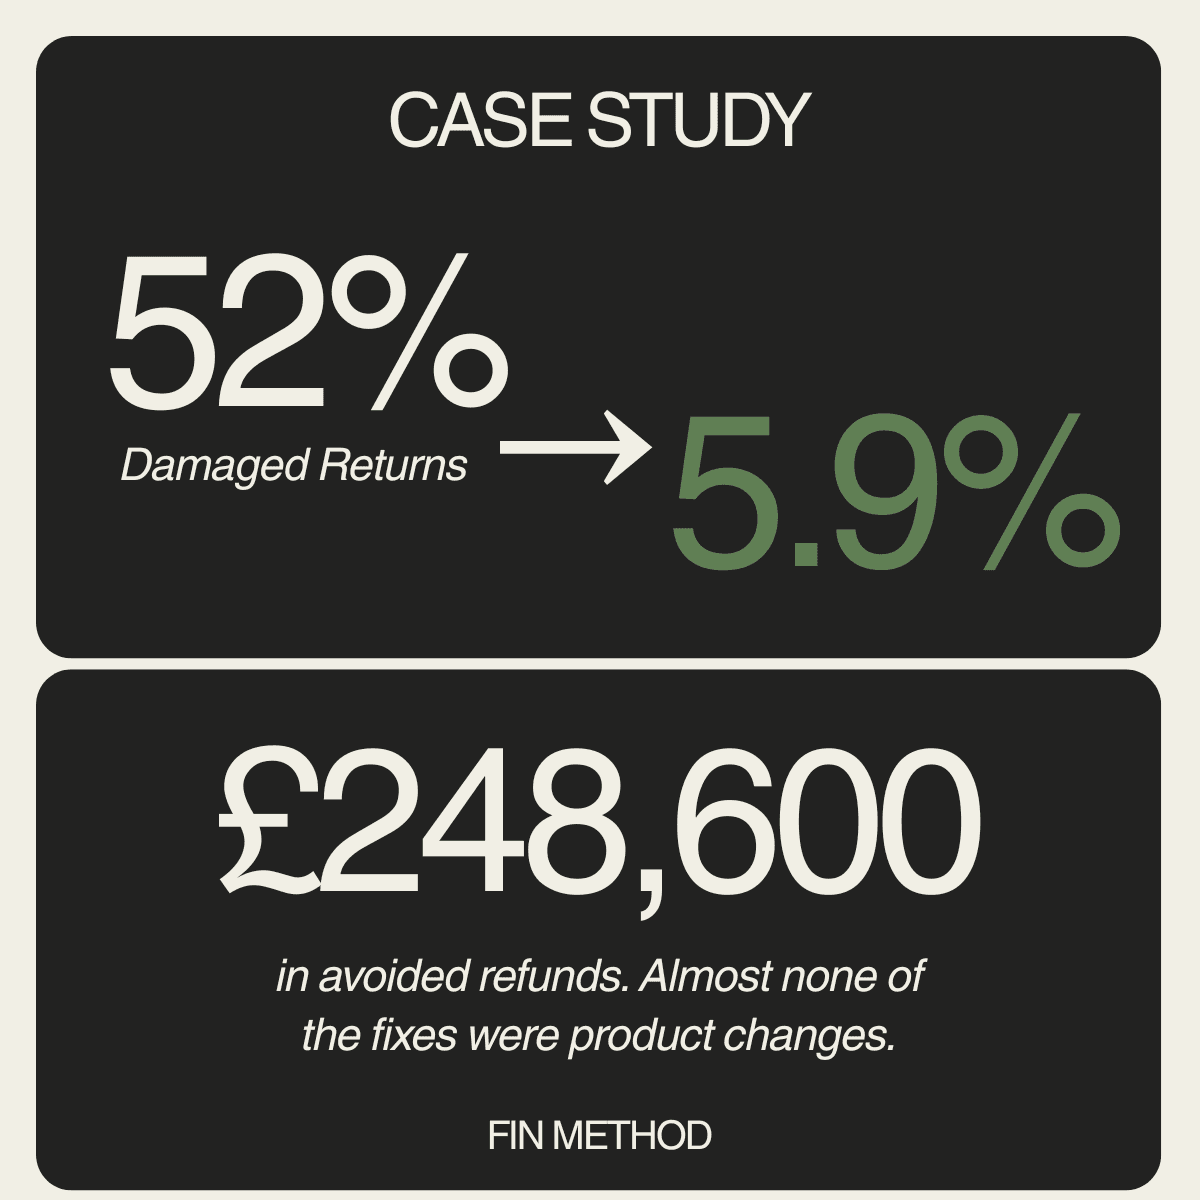
I know this because I ran a UK ecommerce operation that took the recliner range return rate from 52.1% to 5.93% in a single year, and a separate outdoor cooking product line from a similar baseline to 1.71% across nearly 2,700 units sold. Combined avoided refund exposure across those two ranges alone: roughly £248,600.
Almost none of the fixes were product changes.
This post is the operator's guide to the diagnostic and the fixes — with the actual numbers, the specific interventions, and the systems-thinking lesson that reshaped how I approach ecommerce operations entirely.
The three types of returns most operators conflate
The first mistake is assuming all returns are the same problem. They're not. In the operation I ran, returns fell into three genuinely distinct categories, each requiring a completely different fix.
Type 1 — Transit damage. The product was genuinely damaged in shipping. The customer received a broken frame, a torn box, or bent components. Their complaint is legitimate. Your fix is operational (packaging, courier, handling).
Type 2 — Storage or usage damage the customer thinks is a product fault. The product arrives fine. The customer uses or stores it incorrectly. Damage develops. The customer attributes the damage to the product and returns it. Your fix is educational (instructions, content, customer service scripts).
Type 3 — "Damage" that isn't damage at all. The product is exactly as described. The customer misunderstood something at purchase — sizing, box quantity, assembly requirements — and returns the product citing a fault that doesn't exist. Your fix is informational (PDP copy, size guides, comparison tables).
Every operator I've talked to lumps all three into "returns" and tries to solve them with the same tool. That's why most returns reduction initiatives fail. Each type needs its own workflow, its own metrics, and its own operational owner.
Case 1: The recliner range — a genuine transit damage problem
In Q1 2024, our recliner range had a return rate of 52.1% — 73 returns from 140 units sold.
That's not a customer service issue. That's a broken operation.
The diagnostic came from reviewing return reasons alongside actual customer photographs. What we saw was consistent: bent frames, torn packaging, dented components. This wasn't customers being unreasonable. This was product arriving broken.
The root cause was courier handling. The recliners shipped as a single heavy package, and couriers handling large single boxes have documented higher damage rates than couriers handling multiple smaller boxes for the same shipment. The physics of a single 40kg box is genuinely different from two 20kg boxes — the handling force, the drop risk, the stacking pressure are all worse.
The fix was purely operational. We redesigned the packaging to split the product across two shipping cartons. Same product. Same components. Different distribution across boxes.
By Q4 2024, on 573 units sold, the return rate was 5.93% — 34 returns.
That single change avoided approximately £38,600 in refund exposure across the compared periods, before accounting for downstream effects on reviews, replacement logistics, and customer lifetime value.
The lesson wasn't sophisticated. It was: your courier's damage rate is a function of your packaging design decisions. Two smaller boxes is often cheaper than one big one, even factoring in additional freight charges. Test it on your highest-return SKUs first.
Case 2: The outdoor cooking range — an education problem disguised as a product fault
This one taught me more about ecommerce operations than any other single project I've worked on.
The product was a large outdoor smoker BBQ. Customers loved the product. Reviews were largely positive. But return rates were still uncomfortably high, and the complaint pattern was consistent: the BBQ was rusting.
The customer story was almost identical every time. They bought the BBQ. They bought the weatherproof cover we sold alongside it (an actively encouraged upsell). They used the BBQ, then immediately covered it. Or they covered it permanently outside between uses.
Within weeks or months, they noticed rust developing. They contacted customer service. They returned the product citing manufacturing defect.
The obvious response would have been to redesign the product with better rust protection. That's the expensive response. It's also the wrong response.
Because the product wasn't the problem.
The cover was successfully keeping rain off the BBQ. It was also trapping moisture and warm air inside, creating condensation, which caused rust and paint deterioration on a hot metal surface stored damp under an insulating cover. This wasn't a manufacturing flaw. It was a physics-of-condensation problem that no smoker sold anywhere solves — but our marketing had actively encouraged the exact behaviour that caused the damage.
The fix wasn't product engineering. It was information engineering.
We redesigned the instruction manual from the ground up. Internally we called it the BBQ Bible because it grew into a comprehensive care and use document rather than a set of assembly instructions. It covered:
- Seasoning instructions
- Explanation of condensation and why it develops
- Airflow guidance for storage
- When to use covers and when not to
- Cleaning frequency and technique
- Flare-up prevention
- Cover-off-first-hour drying protocol
- Maintenance schedules by season
That single document then propagated across the operation. It became the basis for updated customer service scripts (so that inbound "my BBQ is rusting" calls became educational conversations instead of return authorisations). It became the basis for blog content. It informed PDP copy. It even became internal training material for new team members.
By May 2024, on 2,695 units sold, we saw 46 returns — a return rate of 1.71%.
Modelled against the previous high-return category baseline for this product line, we estimated approximately £210,000 in avoided refund exposure in that period alone.
Almost none of that was product work. Nearly all of it was information design.
The lesson from this one is the one I still think about most: many expensive returns happen because customers don't understand perfectly good products. They're not being unreasonable. Nobody taught them the physics of the thing they bought. When customer education happens by accident (via unboxing videos, forums, and their own trial and error), the returns pattern is predictable. When you own the education, the returns pattern collapses.
Case 3: The returns that weren't really returns
The third pattern was subtler and harder to catch, but it was significant enough to warrant its own workflow.
Customers were returning products because they believed they had received the wrong item. In reality, they'd received exactly what they'd ordered. The disconnect was in what they'd expected versus what actually arrived.
The recurring examples:
- Furniture that looked smaller in person than the lifestyle photography suggested
- Seating capacity misunderstandings (buying a "sofa" and being disappointed it only sat two)
- Products arriving across multiple boxes on different days, causing customers to believe components were missing
- Assembly complexity that wasn't disclosed pre-purchase, causing frustration
None of these were product problems. All of them were communication gaps between the PDP and the customer's expectations.
The fix was to rebuild how our product listings communicated. Working with our Shopify developer, we introduced:
- Seating comparison tables — clear visualisation of how many adults fit on a given product
- Size guides showing product-in-context — the product next to a person for scale
- Box configuration information — "arrives in 2 boxes shipped separately" as an explicit pre-purchase disclosure
- Assembly guidance — realistic time estimates and required tools before checkout
- Feature comparison layouts — showing what makes each SKU different from adjacent products
None of these were revolutionary. All of them addressed specific misunderstandings that had shown up repeatedly in returns data.
The impact on this category showed up as reduced returns and reduced pre-sale customer service enquiries, which is genuinely how you know an information fix is working. Every customer who understands what they're buying before they click "add to cart" is a customer who won't email support to ask, won't return the product because they were confused, and won't leave a review complaining about something the PDP should have communicated.
The 5-step returns audit workflow
If you're a D2C brand with a return rate above industry benchmark for your category, do this. First pass takes 3-4 hours. Quarterly refresh takes 60-90 minutes.
Step 1 — Categorise your returns by type
Pull the last 90 days of returns. For each one, categorise:
- Type 1 — Transit damage (genuine breakage in shipping)
- Type 2 — Post-purchase usage or storage damage (customer thinks product is faulty, but the damage came from how it was used or stored)
- Type 3 — Expectation mismatch (customer received exactly what they ordered but expected something different)
Don't guess. Read the return reasons. Look at customer photos if you have them. Cross-reference with customer service emails from around the same order dates.
You'll typically find a distribution roughly like: 30-50% expectation mismatch, 20-40% education-related damage, 10-30% genuine transit damage. If your distribution is heavier in any one category, that tells you where to focus first.
Step 2 — Identify the top three complaint clusters within each type
Within each return type, identify the specific recurring complaint. Don't accept the surface-level return reason from your returns portal — those are usually pre-populated dropdown options that hide the real cause. Read the customer-written detail.
For each type, the top 3 clusters usually account for 70-80% of the returns within that category. Fix those specifically. Ignore the long tail for now.
Step 3 — Design the fix by type
Different types need different fixes:
-
Type 1 (Transit damage) → operational fix. Packaging redesign, courier change, better handling instructions on the shipping label. Test on high-return SKUs first, roll out if the return rate drops.
-
Type 2 (Education) → content fix. Rewrite instructions. Update PDP copy. Refresh customer service scripts. Add care/use content to your blog and email flows. Don't just describe the product — teach the customer how to use it.
-
Type 3 (Expectation mismatch) → information design fix. Add size guides, comparison tables, in-context photography, honest disclosure of assembly complexity and box configuration.
Any attempt to fix a Type 2 problem with Type 1 tactics (or vice versa) fails. Match the fix to the diagnosis.
Step 4 — Update customer service to be an education channel, not just a returns channel
This is the step most operators skip. Once you've built the education content and information redesigns, your customer service team needs to be the front line of deploying them.
When a customer emails "my BBQ is rusting," the response shouldn't be "we're sorry, we'll process your return." It should be "let me help — often this is caused by condensation from cover use, and here's what's happening..."
Some customers will still want a return. Fine. But many customers, given a genuine explanation and a solution, keep the product. That's the difference between customer service as a cost centre and customer service as a return-prevention channel.
Step 5 — Feed the returns data back into product development and content roadmaps
The final step is the one that compounds long-term. Set up a monthly review where the returns team, the content team, and the product team look at the categorised returns data together.
The returns data is telling you exactly what your PDPs should cover next, what your blog content should teach, what your product roadmap should address, and which SKUs have unresolved fundamental issues.
Most operations run returns and product development as completely separate functions. The operations that reduce returns systematically run them as connected.
Free downloadable toolkit — the framework and tracking sheet
I've built two free resources that make this audit easier to run in your own operation.
 The Returns Categorisation Framework — 2-page PDF
The Returns Categorisation Framework (PDF) — a 2-page framework document covering the 5-type returns categorisation system (COM, NFP, DNM, CED, DAM), the 24-hour response principle, and the options-to-rectify ladder ranked by cost to business. Print-friendly, share-ready for your customer service team.
 The Returns Tracking Sheet — Excel workbook with dashboard
The Returns Tracking Sheet (Excel) — a working spreadsheet with dropdowns for return codes, an auto-calculating Summary Dashboard covering return rate, cost breakdowns, top-returned SKUs, and 3-month trends, plus an ROI calculator that estimates the quarterly saving from reducing your top-return SKU by a target percentage.
Both are free. No email required. Download, use, share with your team.
The systems-thinking lesson
Here's the lesson I still think about, three years later.
When I started this work, I assumed reducing returns meant building better products. I thought if we manufactured better recliners and better BBQs, returns would drop.
That assumption was almost entirely wrong.
The vast majority of the returns we eliminated weren't from making the products better. They were from making the information around the products better. Better packaging design. Better manuals. Better PDP copy. Better customer service scripts. Better educational content.
The mental model I ended up with was this: every return is a signal about a gap somewhere in the system between "customer intent to buy" and "customer confidence after receiving." The gap might be in transit. Might be in instructions. Might be in PDP copy. Might be in aftercare support. But it's always a gap in the system, not a flaw in the product.
Ecommerce operations treats customer service, product development, SEO, UX, and logistics as separate departments. In the operation I ran, we started treating them as one connected system. Every return became a diagnostic signal. Every customer complaint became input for content roadmap decisions. Every review became a source of truth for what the PDP should say.
That systems-thinking approach is what eventually led me toward building Finnito, which is designed around exactly the same principle — every return, review, keyword, customer question, packaging issue, and operational decision is a signal, and connecting those signals into intelligence is what helps operators prevent problems before they happen instead of reacting to them afterward.
But you don't need software to start thinking this way. You need to stop treating returns as a customer service line item and start treating them as diagnostic data across your entire operation.
What this means for your 2026 planning
Return rates for UK D2C brands are getting worse, not better. Courier costs are rising. Return handling fees are compounding. Every return you avoid is compounding margin recovery.
Old model: budget for returns as a cost of doing business. Handle each return through customer service. Move on.
New model: audit returns by type. Fix them systemically. Route the data back into your product content, PDPs, and customer education. Treat returns as the highest-signal operational feedback you receive.
The brands that will win 2026-2027 D2C margins aren't the ones with the cheapest courier deals or the most aggressive returns policies. They're the ones who understand that a well-run returns audit is a compound operations improvement — the fixes reduce returns and reduce customer service enquiries and improve reviews and raise the perceived quality of the brand overall.
Every avoided return is roughly £30-£80 in direct refund and handling savings. That's before you factor in the reputational cost of one-star reviews, the customer lifetime value of a retained customer, or the compounding effect of a lower return rate on your ad platform quality scores.
Do the audit. Categorise the returns. Design the fixes by type. Feed the data back into your operations.
Or keep budgeting for a 30% profit leak that's mostly caused by information gaps you could close in a quarter.
The tools I've mentioned throughout this post — the 5-type categorisation framework PDF and the tracking sheet Excel — are free. Download them, run the audit on your own catalogue, and see what patterns surface.
If you'd rather have someone else do the diagnostic for you, Fin Method's Return Patterns Analysis (£550) covers return data analysed across up to ten SKUs with reasons mapped, root causes identified, and specific changes recommended. If your returns data suggests the underlying issue is in your customer feedback loop, Review & Feedback Analysis (£450) covers themed analysis of customer reviews across a product line. And if you need to rebuild your Amazon PDP content specifically to close pre-purchase information gaps causing avoidable returns, Amazon A+ Content (£450) delivers a complete module set with copy, layout direction, and image briefs. Fixed price. No retainers.